
n8n uptime and workflow health

n8n uptime. Read the signal.

n8-m8 helps you assess whether authorised n8n instances and workflows appear healthy, degraded, stale, missing, slow, or failing—then carries you into the execution history behind that signal.

n8-m8 provides best-effort visibility. It does not provide a guaranteed availability measurement or SLA.

Health trend view ready
Real product interface
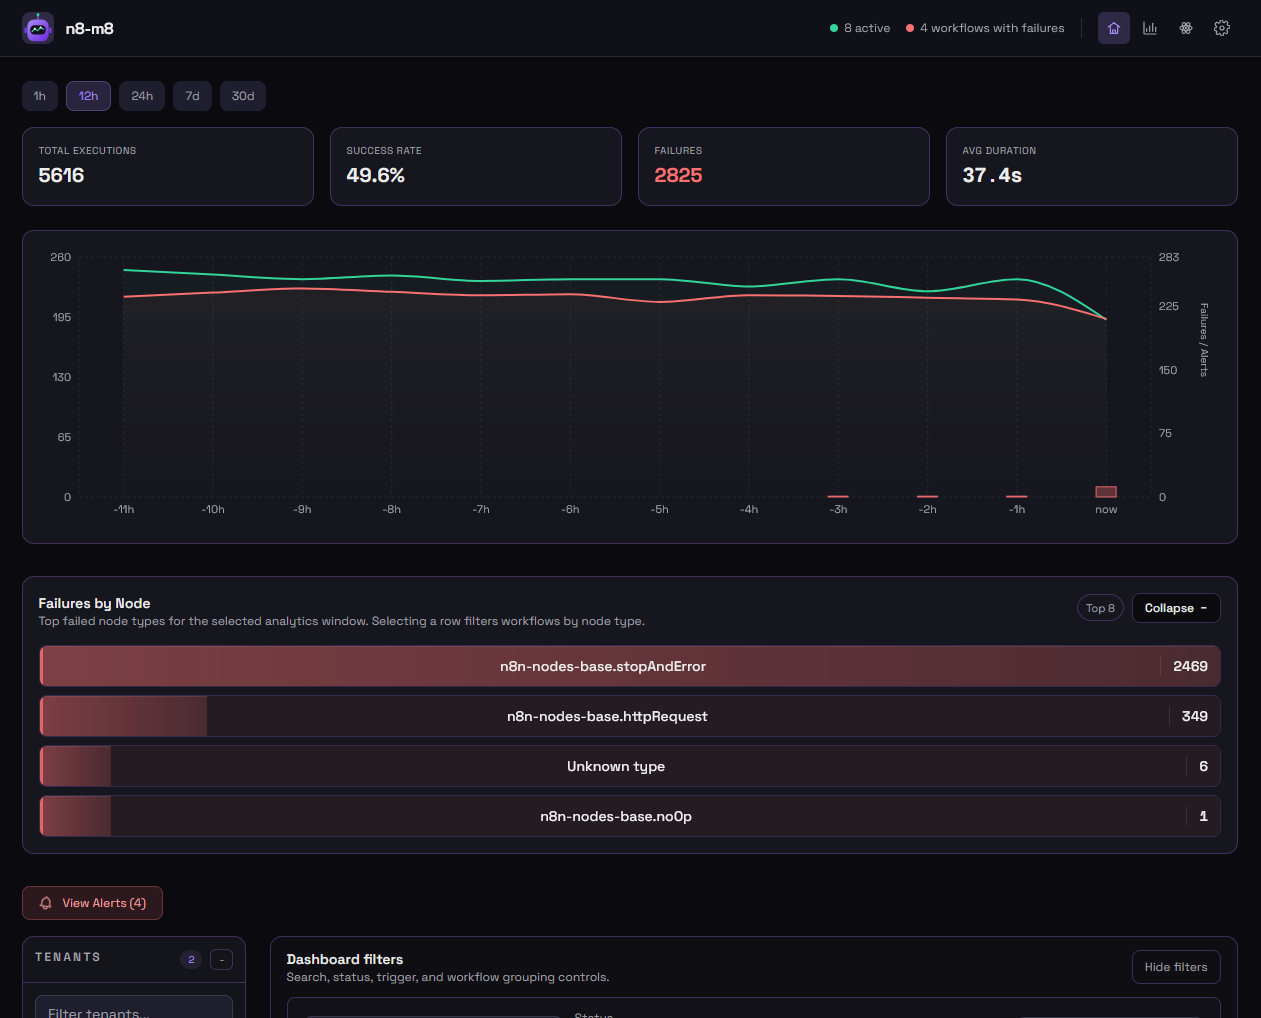
n8-m8 analytics view showing execution totals, success rate, failures, duration, and failed-node trends
  1. 01

    watch workflow state

  2. 02

    trend execution health

  3. 03

    trace failure context

Execution volume, success rate, failures, duration, and failure-by-node context from a real n8-m8 product view.

What does n8n uptime mean here?

In n8-m8, uptime is operational visibility derived from the data available in your authorised environment: whether an instance or workflow appears healthy, responsive, current, and able to execute as expected. It is a best-effort signal, not a guarantee that every workflow or dependency is available.

Beyond a single status

“Up” is rarely the whole answer.

An instance can respond while a workflow fails repeatedly. A workflow can be enabled while its expected schedule goes stale. A healthy-looking fleet can still hide one degraded tenant.

n8-m8 puts the available instance, workflow, execution, duration, and change signals next to each other so you can form a better operational picture.

Fleet health

See the outlier without flattening the fleet.

Tenant grouping helps operators keep one degraded environment distinct from the rest, while workflow-level context shows the recent runs, failures, duration, and available uptime indicators behind the state.
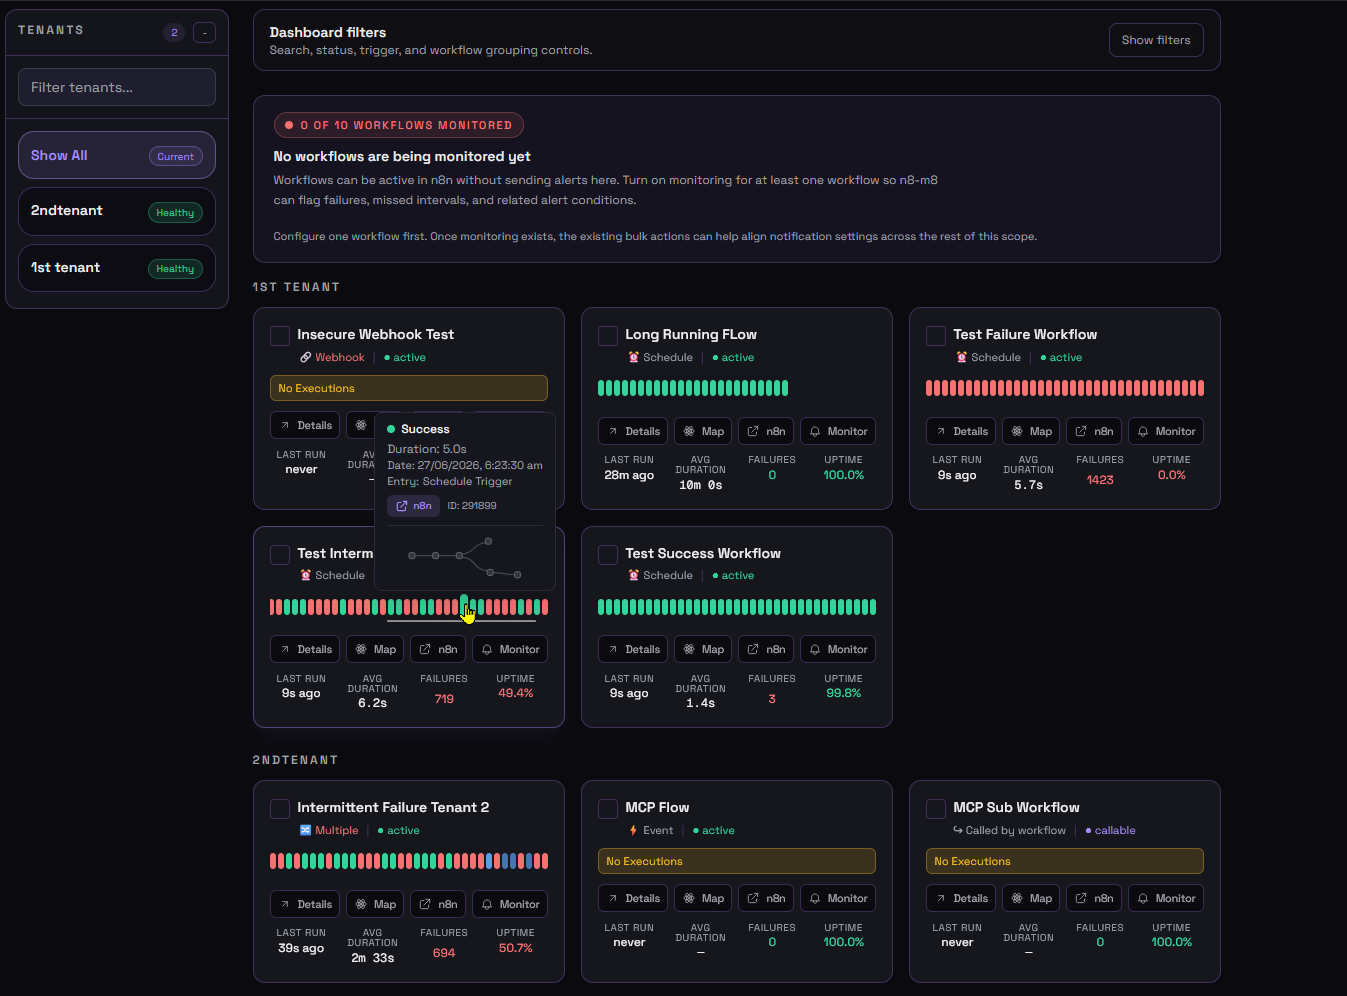
n8-m8 dashboard grouped by tenant with labelled workflow states, recent runs, failures, duration, and uptime indicators
Health and failure states remain labelled so meaning does not rely on colour.

Available evidence

Read health across several dimensions.

Instance and tenant state
Identify environments that appear healthy or degraded based on the information n8-m8 can currently reach.
Last-run timing
Compare recent and expected execution activity to help surface workflows that may be stale or missing runs.
Success and failure trends
Review execution history and changes in success or failure behaviour over the selected analytics window.
Execution duration
Use available timing history to see where runs appear slower or different from the recent pattern.
Waiting and running states
Keep long-lived or unfinished execution states visible beside completed successes and failures.
Change context
Place workflow updates beside the execution behaviour that followed, without claiming that correlation proves cause.
From state to evidence

A failure count should lead somewhere.

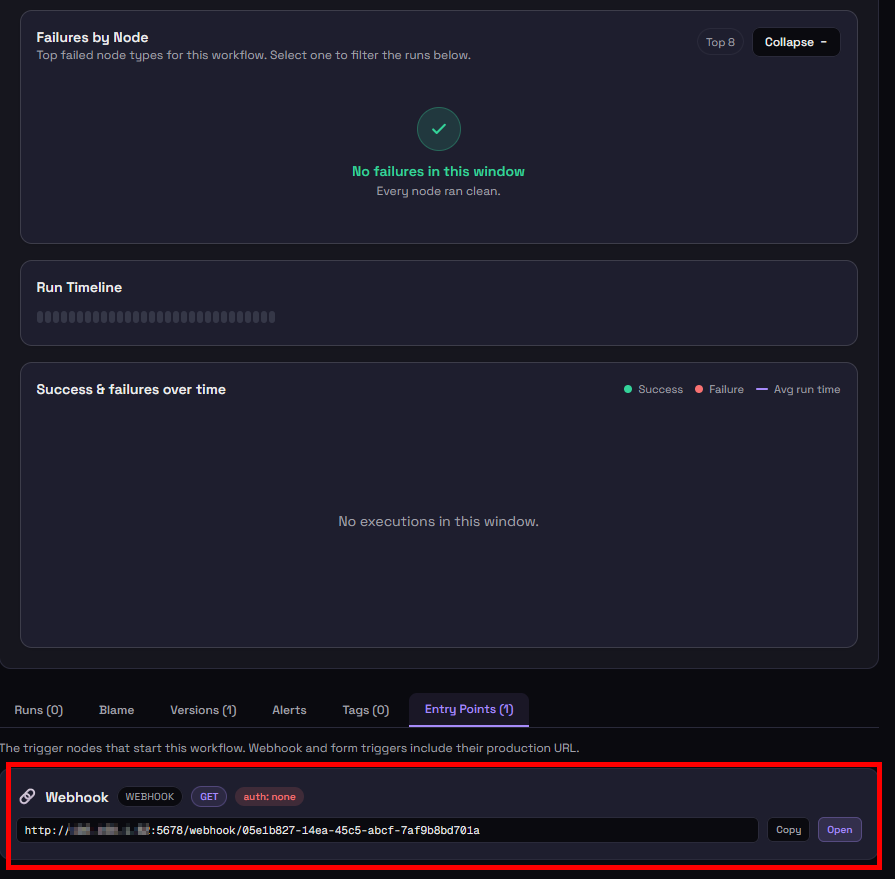
Drill into entry nodes, failures by node, execution timing, and the run timeline for the selected workflow. The view stays grounded in the data available from your environment.

See the complete n8n monitoring workflow
n8-m8 workflow details showing entry nodes, last-run timing, and labelled failures by type
Entry points, last-run context, and failures by type.

Important limit

Visibility can fail too.

API availability, configuration, token scope, network conditions, product changes, polling, storage, and the n8-m8 deployment itself can affect what the dashboard sees and when it sees it.

n8-m8 can miss events, report stale or incomplete data, generate false positives or false negatives, delay alerts, or become unavailable. It should not be your only uptime monitor or incident-response control.

Review deployment security

Set the right expectation.

How n8-m8 uses available operational data, what its health signals mean, and why visibility remains best effort.

What does n8n uptime mean in n8-m8?

n8-m8 uses the operational data available from your authorised environment to help you assess whether instances and workflows appear healthy, degraded, stale, missing, or failing. It is visibility, not a guaranteed availability measurement or SLA.

Can n8-m8 show workflow health over time?

Yes. Available product views include execution history, success and failure trends, duration, recent-run context, and per-workflow metrics that help you investigate changes over time.

Can I rely on n8-m8 as my only uptime monitor?

No. n8-m8 is a best-effort visibility tool and should not be your only monitoring, alerting, incident-response, backup, audit, or business-continuity system, especially for critical workflows.

Is n8-m8 a hosted uptime service?

No. n8-m8 is self-hosted software that runs in your environment. The n8-m8 project does not operate, host, manage, secure, or back up your deployment unless separately agreed in writing.

Self-hosted visibility

Put workflow health where you can inspect it.

Review the source and start free for eligible personal and non-commercial use.