
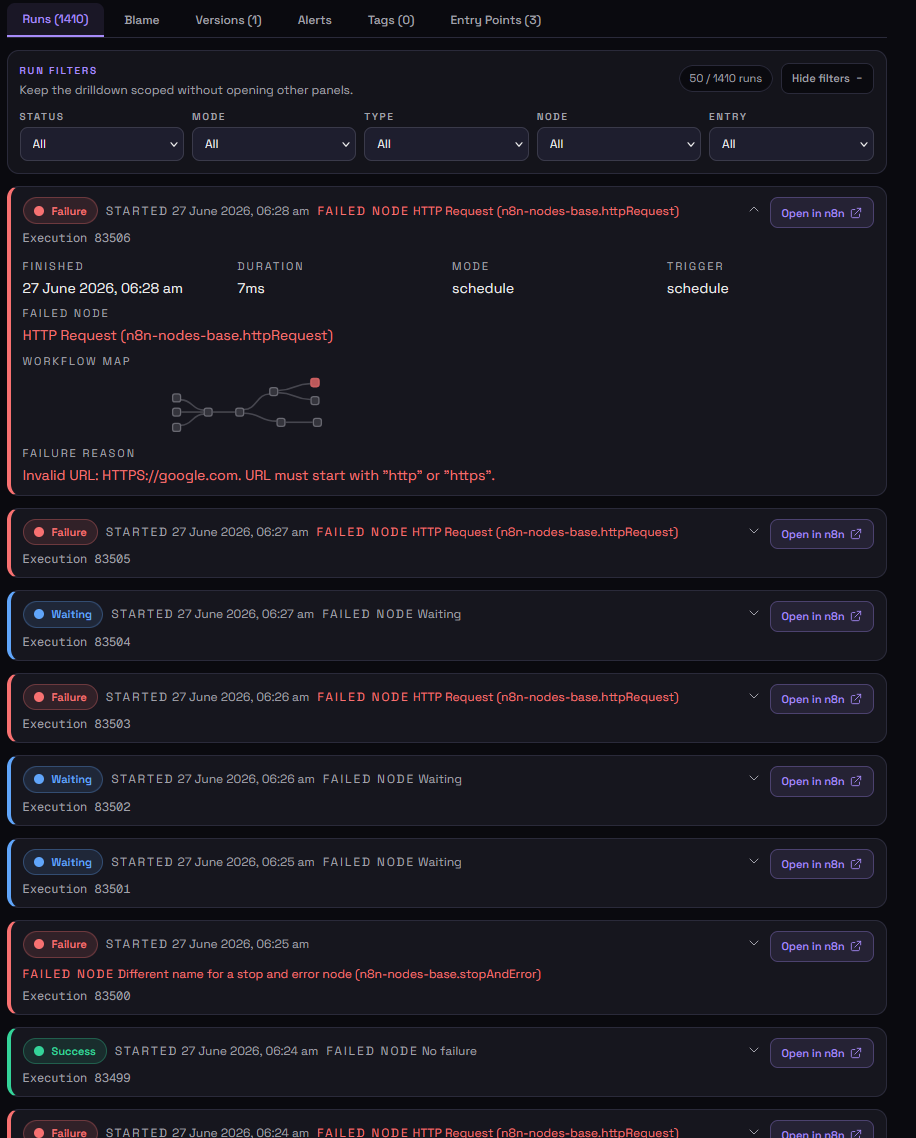
Execution history
The run list is only the beginning.
Status filters, timing, failed nodes, execution identifiers, failure reasons, mini maps, and deep links give each run enough surrounding information to begin an investigation.
Self-hosted n8n monitoring
n8-m8 is a source-available monitoring layer for authorised n8n instances. It brings health signals, execution history, logs, alerts, tenant context, workflow relationships, and version changes into one place.
Independent software. Best-effort monitoring. Personal and non-commercial use is free under the EULA.
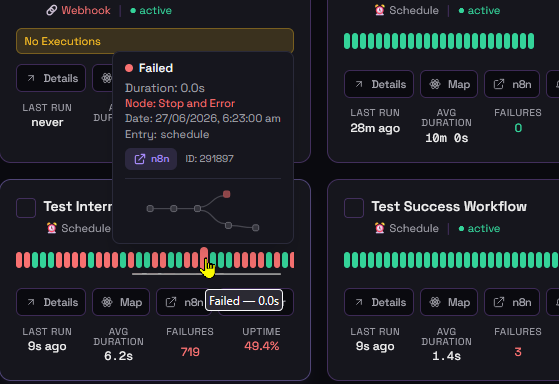
watch workflow state
trace execution path
inspect change context
n8n monitoring is the practice of observing instance and workflow behaviour so operators can identify failed, delayed, stale, missing, or changing automation. n8-m8 uses data available through your customer-authorised environment to provide best-effort visibility into those conditions.
Coverage that follows the investigation
Monitoring is most useful when each view answers the next operational question. n8-m8 connects fleet state, workflow state, run history, and change context rather than leaving them as isolated dashboards.
Status filters, timing, failed nodes, execution identifiers, failure reasons, mini maps, and deep links give each run enough surrounding information to begin an investigation.
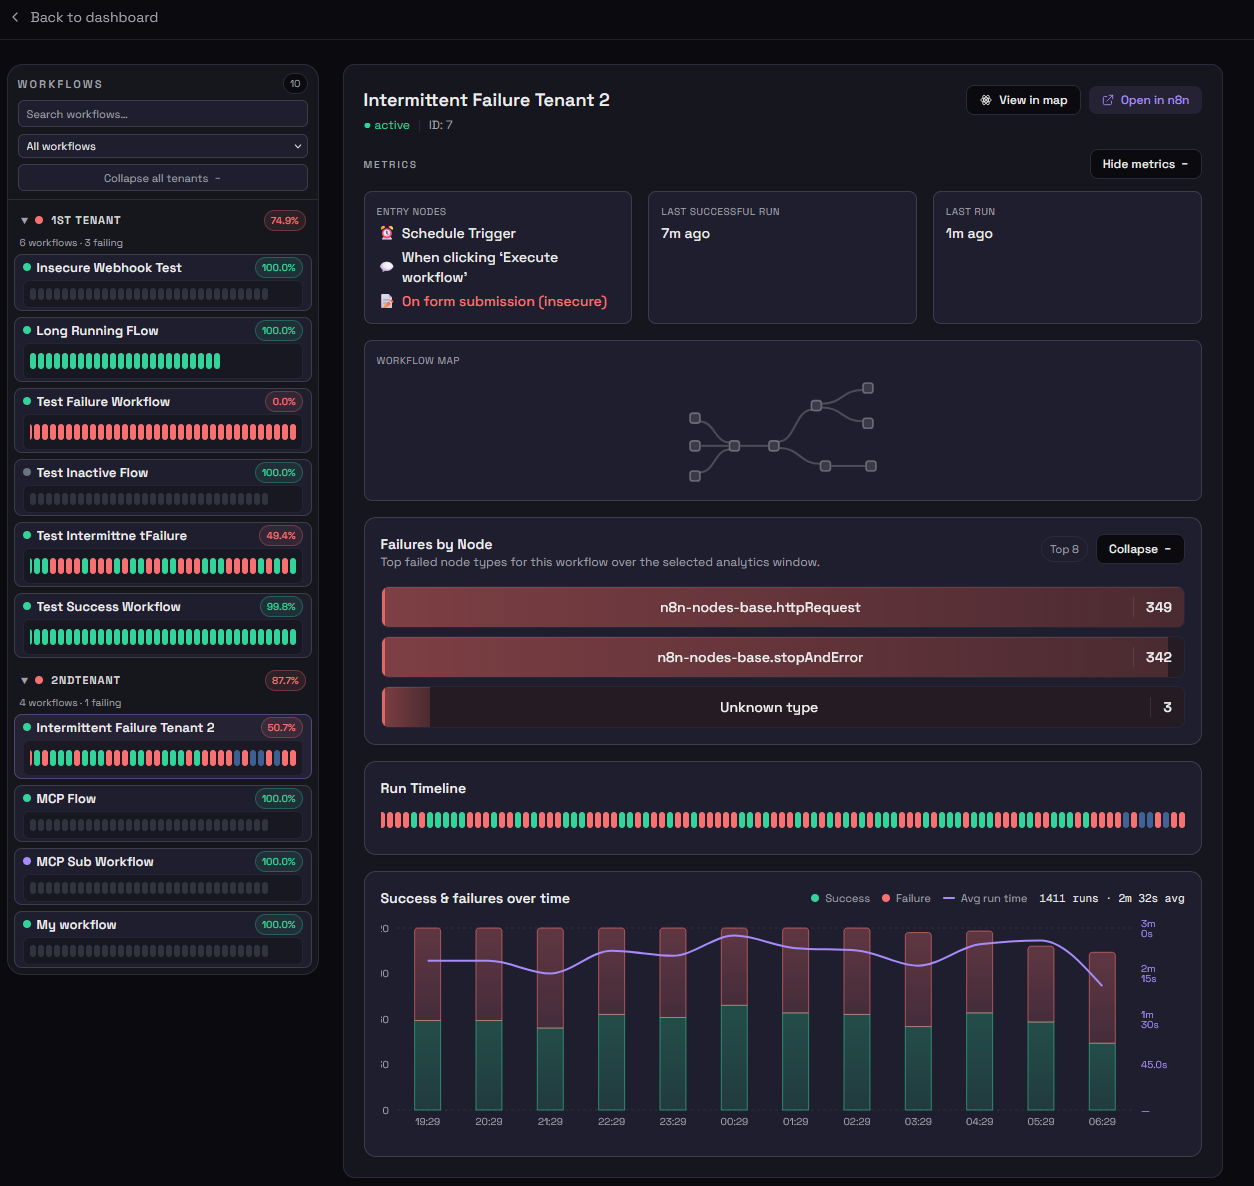
Per-workflow views bring entry nodes, last-run timing, failure-by-node context, execution timelines, and success/failure history together for the selected analytics window.
Available data depends on your n8n version, configuration, access scope, and the health of the systems between n8-m8 and the authorised instance.
Deployment path
Review the source and documentation, then deploy n8-m8 in your own environment using Docker.
Connect only instances you are authorised to monitor and use the least-privileged n8n access your setup allows.
Use n8-m8 as one best-effort source of operational visibility, alongside appropriate alerting, backups, audit, and incident-response controls.
The honest boundary
n8-m8 does not guarantee detection of every failure, delay, outage, stale workflow, missed execution, configuration problem, security issue, or data exposure.
It can produce false positives, false negatives, stale information, incomplete data, delayed alerts, or no alerts at all. Read the security notes before exposing any deployment.
What the monitoring layer can see, how it connects, and where its best-effort boundary sits.
Using the data available from your authorised n8n instances, n8-m8 can surface workflow health, recent and historical executions, failures, waiting or stale states, logs, tenant status, workflow relationships, alerts, and change context.
Yes. It is designed to provide tenant-aware visibility across one or multiple authorised n8n instances, including degraded-state context for the environments you operate.
n8-m8 runs separately from n8n and uses customer-authorised access. Use the least-privileged access your n8n setup allows. You remain responsible for token scope, access controls, and deployment security.
No. Monitoring is best effort. API availability, configuration, polling, network conditions, product changes, and other factors can lead to missed, delayed, stale, incomplete, false-positive, or false-negative results.
Looking specifically at availability signals? Read the n8n uptime guide.
Source first
Start free for eligible personal and non-commercial use. Commercial-use licences are published separately and transparently.